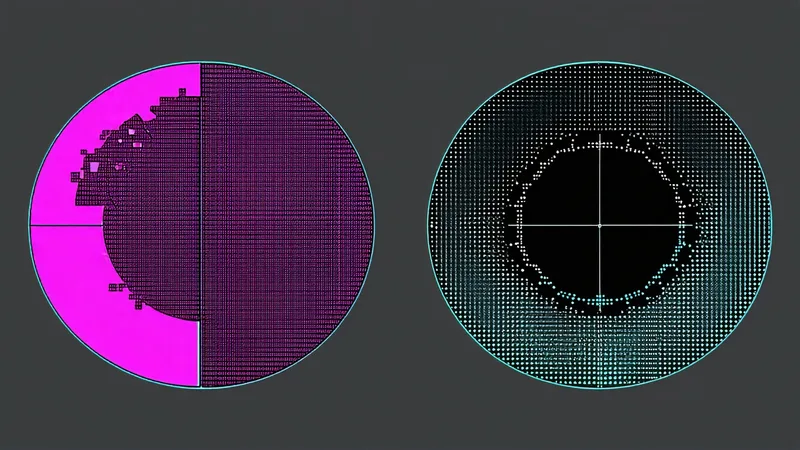
Spatial Patterns in Wafer Maps: Systematic vs Random Defect Signatures
Understanding the geometry of defect clusters is the first step to attributing yield loss to a specific process step or equipment chamber.
Read articleWafercadence correlates in-line inspection data, SPC charts, and FDC events in real time — giving your yield team a 12-minute alert-to-root-cause window, not a 4-day post-mortem.
Connect KLA KLARF, ASML IBIS, optical wafer scanner output, and SPC streams via SECS/GEM or direct file drop. No change control required.
The Yield Intelligence Engine cross-correlates defect coordinates, process layer, equipment ID, chamber number, and recipe version — in under a minute.
Your yield engineer receives a ranked evidence package: spatial pattern, probable layer of origin, chamber attribution, and recommended disposition — before the next lot enters the affected module.
CNN-based classifier trained per process node and defect family. Confidence score with every result. No generic model reuse across nodes.
Learn more →Cross-correlate WAT probe, parametric test, and inspection data. Find the layer-to-device kill ratio before it shows up in sort yield.
Learn more →Edge ring, center spot, arc, scratch — detected at low D0 counts where standard SPC rules are blind. Systematic vs random classification included.
Learn more →Signature analysis across chamber ID, slot position, process recipe version, and operator shift. Pinpoints the golden chamber reference for qualification.
Learn more →EWMA filter, Cpk/Ppk live computation, RtR control loop feedback. Bidirectional: Wafercadence reads SPC and writes corrective action signals back to APC.
Learn more →GEM300, SECS-II/HSMS, e-Diagnostics. Compatible with Workstream, Camstar, Synopsys Yield Explorer, and PDF Solutions Exensio. On-premise, air-gapped option available.
Learn more →
A particle excursion on a CMP tool generates 3 wafer maps with edge-ring signatures. Wafercadence correlates to chamber 3B, flags all lots processed in the previous 8-hour window, and issues disposition recommendation before engineering shift change.
Recipe drift detected across 4 etch chambers via Cpk degradation. Commonality analysis identifies Chamber 2A as the outlier. Golden chamber requalification package auto-generated.
Sort yield drops 2.1% across an 8-week window. Bin 5 failure clusters correlate to a photolithography overlay shift 3 layers upstream. Root cause found in 47 minutes — not 4 days.
Wafercadence was founded in San Jose in 2024 by Kenji Nakamura, a process integration engineer with 13 years across logic and DRAM memory nodes. The platform grew from a failure he saw repeat at every fab he worked in: the KLARF files, the SPC degradation, and the FDC event were all there on Monday morning — sitting in three separate databases, no engine correlating them. By Friday the post-mortem was done. By then, 40 more wafer starts had crossed the diffusion line.
Our Story
Understanding the geometry of defect clusters is the first step to attributing yield loss to a specific process step or equipment chamber.
Read article
The gap between alert and corrective action is where yield loss compounds. Here's how FDC integration cuts that window from hours to minutes.
Read article
When one chamber drifts out of spec, the kill ratio signature tells you which lots to quarantine before they reach sort.
Read articleSchedule a technical evaluation with our yield engineering team. Bring your KLARF files — we'll show you what Wafercadence finds in 30 minutes.