
CDSEM Review Image Classification: How Model Accuracy Changes Across Defect Families and Process Nodes
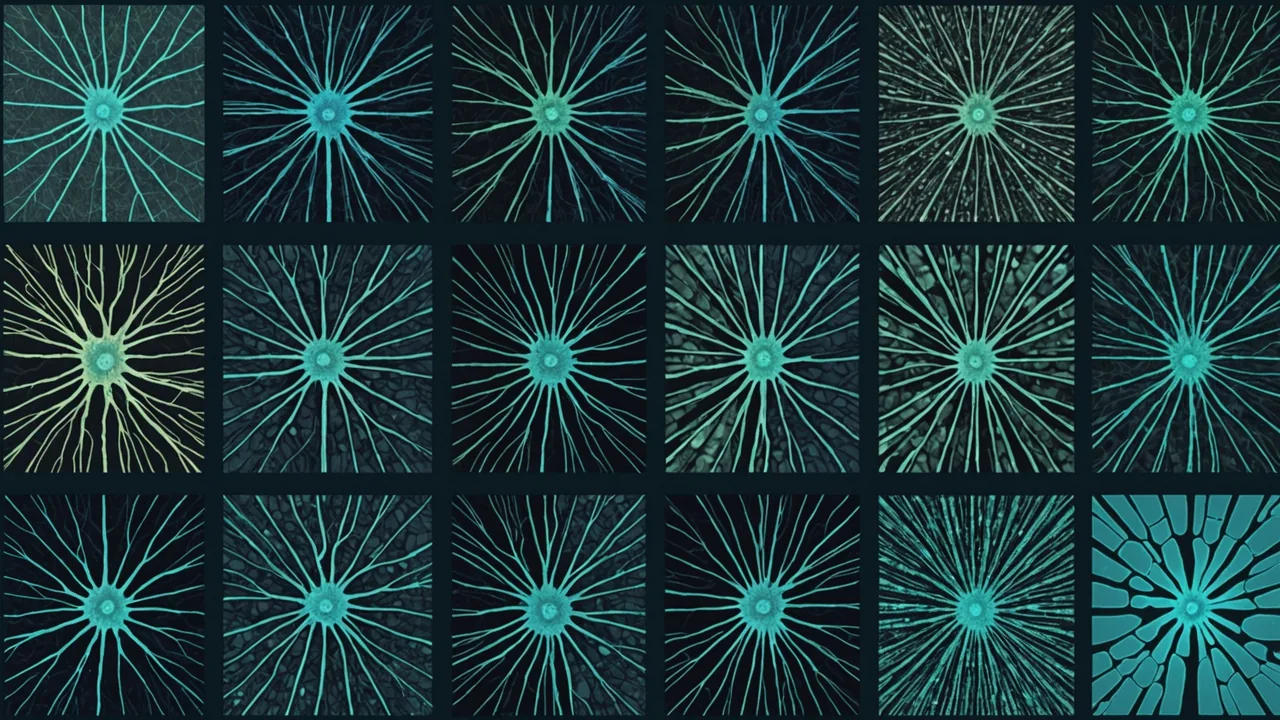
CDSEM review images are the highest-information defect data source in the fab, and also the hardest to classify reliably with a CNN. Unlike brightfield or darkfield optical scanner images — which capture surface reflectance patterns at relatively low magnification — CD-SEM images show individual defect morphology at sub-10nm resolution. The trade-off is that every defect family looks significantly different depending on process node, layer material, and SEM operating parameters. A bridging defect at 14nm looks different from a bridging defect at 7nm, and both look different from bridging defects captured on a tungsten layer versus a low-k dielectric.
We've spent considerable time characterizing exactly where classification models break down and why. The accuracy picture is not uniform across defect families or nodes, and understanding the variation matters for how you configure confidence thresholds in production.
Accuracy by Defect Family: Where Models Are Strong and Where They Aren't
Across our classification work on CDSEM review images, accuracy varies significantly by defect type. The general pattern:
| Defect Family | Typical Accuracy Range (14nm) | Key Accuracy Driver |
|---|---|---|
| Particle (large, >50nm) | 96–98% | High contrast, distinctive morphology |
| Scratch / linear | 93–96% | Directional signature is detectable even at low SNR |
| Pit / void | 88–93% | Morphology varies by layer material; depth ambiguity |
| Bridging | 85–91% | Context-dependent: needs pattern neighborhood to distinguish from intentional contact |
| Pattern anomaly / shift | 78–86% | Requires reference comparison; high false-positive rate without good training distribution |
| Particle (sub-20nm) | 71–82% | Near noise floor at standard SEM dose; size ambiguity |
These ranges are not universal — they're representative of what we see across different fab processes. Your numbers will differ based on SEM tool settings, layer stack, and training set composition. But the relative ordering is fairly consistent: large particles are easy, sub-20nm particles and pattern anomalies are hard, bridging is in the middle but is the most consequential classification because bridging defects have very high kill probability.
Node-Dependent Morphology Shift
Moving from 14nm to 7nm to 5nm doesn't just change feature size — it changes the morphological signature of every defect family. This is the part that training set composition has to account for explicitly, and frequently doesn't.
At 14nm, a bridging defect between two metal lines typically shows a narrow filament with clear contrast relative to the surrounding lines. At 7nm, the same defect type may span a gap that is physically smaller than the SEM beam diameter at standard operating settings, producing an image that looks like a CD variation rather than a distinct bridge. The defect is real and electrically significant, but the visual cue is different. A model trained entirely on 14nm examples and applied to 7nm images will under-call bridging defects systematically — not because the model architecture is wrong, but because the training distribution doesn't represent the target domain.
The same problem applies to pits and voids in low-k dielectric layers at advanced nodes. At 14nm, a pit shows as a well-defined dark region. At 7nm, pits in porous low-k materials show irregular edge morphology that partially overlaps with the visual signature of a pattern edge in the reference image. The model needs explicit training examples of this overlap condition — and those examples are only available from production data at the relevant node.
Training Set Bias: The Invisible Accuracy Problem
The accuracy numbers a model produces during offline validation frequently don't match what happens in production. Usually the culprit is training set bias — the training data was collected under conditions that don't represent the distribution of the production inspection flow.
Three biases are common in practice:
- Engineer-reviewed sample bias: Training sets built from engineer-reviewed samples over-represent high-confidence, visually clear defects. In production, 15–30% of CDSEM review images are ambiguous — partial focus, charging artifacts, edge cases at defect boundaries. If those cases aren't in the training set, the model has no learned behavior for them and defaults to whichever class boundary they fall nearest to.
- Time-of-collection bias: Training data collected during a single quarter captures a specific process window. If the process drifts — new resist formulation, equipment maintenance change, new lot of consumables — defect morphology shifts subtly. Models trained on static historical data degrade against the new distribution without explicit retraining triggers.
- Class imbalance: Most production inspection flows generate far more particles than bridging or pattern anomaly events. If training data reflects this imbalance uncorrected, the model learns to over-classify ambiguous inputs as particles. Minority class defects — the ones that actually kill yield — get misclassified at higher rates than the aggregate accuracy number suggests.
When we audit classification pipelines that are underperforming, training set bias is the root cause in roughly 60% of cases. The model architecture is usually fine. The data it was trained on doesn't represent what it's being asked to classify.
Confidence Calibration and Low-Confidence Bin Handling
A CNN classification output is a probability vector. In practice, most production pipelines collapse this to a single class label by taking the argmax. That's fine for high-confidence outputs, but it discards information for borderline cases.
In our production classifier, we route low-confidence outputs — cases where the top class probability is below 0.75 — to a separate review queue rather than assigning them to the highest-probability class. This matters for two reasons: first, low-confidence outputs have higher actual error rates than their predicted class label implies, and misclassifying a bridging defect as a particle can cause a high-kill event to be logged as low-priority. Second, accumulating the distribution of low-confidence cases over time is one of the most reliable signals for detecting model drift — when the volume of outputs below the confidence threshold rises, it usually means the production distribution has moved away from the training distribution.
Calibration — the alignment between predicted probability and actual accuracy at that probability level — is worth measuring explicitly. A well-calibrated model that says 80% confidence should be correct 80% of the time. In our experience, models trained on imbalanced class distributions are typically over-confident on majority-class predictions and under-confident on minority-class ones. Platt scaling or isotonic regression calibration applied post-training corrects this without retraining the underlying network.
Practical Implications for Production Deployment
Given these accuracy characteristics, the practical architecture for a production CDSEM classification pipeline should include explicit provisions for confidence routing, node-specific model variants, and quarterly retraining on production review images that capture the current process distribution. Using a single model across multiple nodes — or updating a model infrequently — is the most common configuration we see in fabs that are dissatisfied with their classification results. The model isn't wrong; it's just being asked to classify a defect population it wasn't trained on.
For fabs running both 14nm and 7nm on the same inspection line, we recommend separate model instances per node with a routing layer that selects the correct model based on lot product ID. The overhead is modest — two model instances on the same GPU rather than one — but the accuracy improvement at 7nm is substantial, typically 8–12 percentage points on bridging and pattern anomaly classes.
Related Articles