A fab's yield review meeting has a characteristic rhythm: an excursion happened, the affected lots were identified after the fact, root cause was found on day 3 or day 4, and the corrective action is documented for the next QBR. The post-mortem cycle is so normalized it has a name. What it rarely has is a rigorous accounting of the wafers lost between the moment the excursion began and the moment engineering knew about it with enough evidence to act.
That accounting is uncomfortable. A 4-day root-cause cycle at a 300mm logic fab running 1,000 wafer starts per day means potentially thousands of wafers processed through an affected module before the lot hold list gets generated. Not all of those wafers are lost — some may be reworkable, some may not show the defect at the specific layer affected — but the exposure window is the problem. Fault detection and classification (FDC) systems have existed for decades precisely to compress that window. The question is why compression to 12 minutes is possible in principle but relatively rare in practice, and what has to be true about an FDC alert for an engineer to act on it in that timeframe.
What FDC Actually Measures
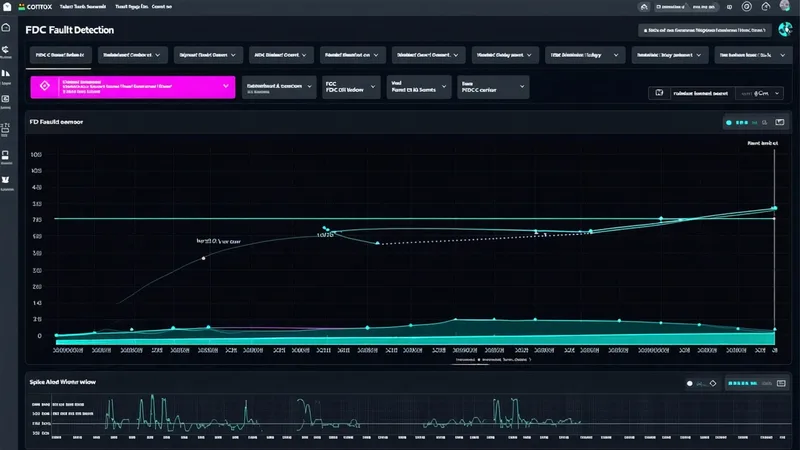
FDC systems monitor equipment process parameters at trace data resolution — typically 1–10 Hz per parameter — and compare the live stream against a reference model derived from a golden run or a statistical baseline. The parameters under surveillance vary by equipment type, but the canonical set for etch and deposition tools includes:
- Chamber pressure — absolute pressure (mTorr) and pressure delta across a recipe step
- RF power — forward and reflected power for plasma processes, with reflected power ratio as a key excursion indicator
- Temperature delta — chuck temperature, chamber wall temperature, and the difference between set point and actual
- Gas flow rates — individual mass flow controller (MFC) readings, often compared as ratios between gases when the ratio is process-critical
- End-point signal — optical emission spectroscopy (OES) intensity for processes where end-point is actively detected
- Cycle time — step duration against recipe nominal, with sigma thresholds
An FDC alarm fires when one or more of these parameters exceeds a threshold relative to the baseline. The threshold can be defined as a fixed limit, a 3-sigma control band derived from the parameter's historical distribution, or a 6-sigma narrow band used for critical parameters where false negatives carry higher cost than false positives.
The False Positive Rate Problem
The most common failure mode in deployed FDC systems is not missed excursions — it is alert fatigue from false positives. When a fab runs hundreds of FDC parameters on dozens of tools with 3-sigma thresholds, the probability of at least one alarm per wafer run can exceed 30% even on a process running nominally. Engineers learn to ignore FDC alerts. The system becomes a compliance artifact rather than an operational tool.
We're not saying that tight FDC thresholds are wrong — we're saying that an alarm without an evidence package attached to it is not actionable at the speed the alarm implies. A yield engineer who receives an FDC alert at 2:00 AM saying "chamber pressure delta exceeded 3-sigma on etch tool E14, chamber 2, wafers W03-W07 in lot LOT-5821" still has to do significant investigative work before authorizing a hold. They need to know: has this parameter pattern appeared before, and what did the wafers look like? Is the deviation correlated with any other parameter excursion on this tool? What layer is being processed, and is this layer yield-critical? What does the yield history on this chamber look like over the past two weeks?
That investigative work, performed manually, is what consumes the 4-day window. The 12-minute window only becomes achievable when the alert arrives with the answers to those questions precomputed.
Anatomy of a 12-Minute Evidence Package
Reducing excursion response time from 4 days to 12 minutes is not primarily a data collection problem — most fabs already collect the data. It is a correlation and presentation problem. The evidence package that enables a 12-minute decision needs to contain, at minimum:
| Evidence component | Source system | What it answers |
|---|---|---|
| FDC parameter trace with deviation highlighted | Equipment FDC stream (SECS/GEM) | What changed, when, on which chamber |
| Spatial wafer map from in-line inspection on same layer | KLA-class inspection KLARF | Did defect signature change on wafers processed at the same time? |
| Lot history: which lots passed through this chamber in the 8-hour window before the alarm | MES lot tracking | Exposure scope — how many wafers are at risk? |
| Kill ratio history for this layer and chamber | Yield correlation database (WAT/probe vs inspection) | If the defect pattern holds, what is the expected yield loss? |
| Recipe version at time of excursion vs. golden recipe | Recipe management system | Was there a recent recipe change that could explain the deviation? |
| Chamber maintenance log: last PM date, last qualification run result | Equipment maintenance records | Is this consistent with expected post-PM drift? |
When all six components are assembled automatically and delivered to the on-call yield engineer within the time window of a single wafer run (approximately 12 minutes for many critical etch and deposition steps), the decision to hold lots — or not — becomes a judgment call based on evidence rather than a manual investigation under time pressure.
The Alert→Hold→Release Decision Chain
Even with an evidence package, the decision chain has distinct steps that need defined ownership and time budgets:
- Alert generation (T+0): FDC threshold exceeded, lot and chamber identified, evidence package assembled.
- Engineer notification (T+1–3 min): Alert delivered via on-call system with evidence link. Engineer acknowledges.
- Preliminary assessment (T+3–8 min): Engineer reviews FDC trace, wafer map, and lot history. Decides whether the evidence warrants an immediate hold or a watch-and-continue.
- Lot hold issued (T+8–12 min): If warranted, hold placed in MES. Downstream lots queued for the affected chamber are flagged.
- Root cause investigation (T+12 min – several hours): Engineering team investigates with the initial evidence package as the starting point, not a blank slate.
- Release or quarantine decision: Based on root cause findings, held lots are either released with added test coverage, held for additional inspection, or scrapped.
- Recipe rollback or parameter correction: If a recipe change or equipment drift is identified as root cause, the correction is applied and a qualification run is performed before resuming production processing.
The 12-minute window covers steps 1–4. The question is not whether every excursion warrants a hold — many FDC alerts will resolve to "noise event, continue processing" after a 3-minute evidence review. The question is whether the decision to continue or hold is made deliberately on evidence, rather than defaulting to "continue" because there isn't enough information to act differently.
Scenario: Etch Tool RF Power Excursion, 300mm Fab, Q4 2024
A dry etch tool at a growing logic fab running a 14nm-class node fires an FDC alert at 3:47 AM. The alert: reflected RF power ratio on chamber 1B spiked to 4.2% (threshold: 3.5%) during a critical gate dielectric etch step. The excursion lasted 38 seconds across wafers W11–W15 in lot LOT-7294.
Under the previous manual workflow, this alert would have been logged and escalated to day-shift engineering at 7:00 AM. Day shift would have pulled the FDC trace, cross-referenced the lot tracker, and begun an investigation that — realistically — would have produced a root-cause hypothesis by mid-afternoon. In the interim, lots LOT-7295 through LOT-7298 would have processed through chamber 1B normally.
With an automated evidence package, the on-call engineer receives, at 3:48 AM: the FDC trace showing the 38-second reflected-power spike; the in-line post-etch inspection KLARF for wafers W11–W15 showing a center-cluster signature not present on W01–W10 in the same lot; the downstream lot list showing three additional lots currently queued for chamber 1B; and the kill ratio history for this etch layer, which indicates that center-cluster defects at this step show a 67% die-kill correlation at probe.
The engineer issues a chamber hold at 3:54 AM — 7 minutes after the alarm. The three queued lots are diverted to chambers 1A and 1C. The root cause — a detuned match network that allowed transient impedance mismatch during step 4 of the etch recipe — is confirmed at 6:15 AM and corrected before day shift. Total exposure: 5 wafers. Total wafers that would have been exposed under the prior workflow: approximately 60, across 4 additional lots.
What Fast FDC Cannot Do
We're not saying that a 12-minute FDC response eliminates excursion yield loss. There are structural limits: some excursions produce defects that are not detectable by in-line inspection at the layer where the fault occurs, only manifesting at electrical test. Some root causes require offline analysis — SEM review, cross-section TEM — that cannot be completed in minutes regardless of how fast the initial alert arrives. And some excursions affect a single wafer, for which a 12-minute response time makes no difference at all to the lot exposure count.
The 12-minute target is meaningful precisely in the class of excursions where: the fault is equipment-related (not material-related), the affected parameter shows up in FDC trace data, and the in-line inspection data for the affected layer is already being collected. Within that intersection — which covers the majority of high-impact, multi-lot excursions in typical 300mm production — the response time compression is where the yield math is most favorable.
The data already exists. The correlation is achievable. The bottleneck has been the time between data and decision — and that is an engineering systems problem with an engineering systems answer.