Yield Intelligence Engine
Core yield analytics: yield learning curve tracking, Pareto excursion analysis, kill ratio computation, and cross-layer commonality analysis. The engine that turns inspection data into root-cause evidence.
What the Yield Intelligence Engine does.
The Yield Intelligence Engine is the analytical core of Wafercadence. It takes normalized data from the ingest layer — defect maps, process layer assignments, equipment history, SPC charts, and FDC event logs — and computes a ranked evidence package for every excursion event it detects.
At its core, the engine runs three analysis paths in parallel: spatial pattern correlation, process layer attribution, and equipment commonality scoring. Results from all three paths are merged into a single evidence package with a ranked list of probable root causes.
The engine is designed for on-premise operation. Inference runs locally on the fab's own hardware. Model updates are delivered as validated release packages — no continuous cloud connection required.
The Yield Intelligence Engine is not a process simulator or a yield prediction model. It analyzes data your fab already collects and finds the correlations between signals your yield team does not have time to connect manually. It does not make yield improvement happen — it compresses the time it takes your engineers to find what needs to change.
| Parameter | Description | Value |
|---|---|---|
| Correlation latency | Full lot evidence package | < 60 s on 32-core server |
| Map inference time | Per-wafer map on-premise (A30) | 43 ms |
| Defect classification accuracy | 14nm node and below | 97.3% |
| Kill ratio precision | Layer-to-device correlation | ±0.4% (200-lot calibration) |
| Lookback window | Equipment history cross-reference | Configurable, default 72 h |
| Supported process nodes | Validated at customer sites | 28nm, 14nm, 7nm, 5nm |
Four analytical functions in one engine.
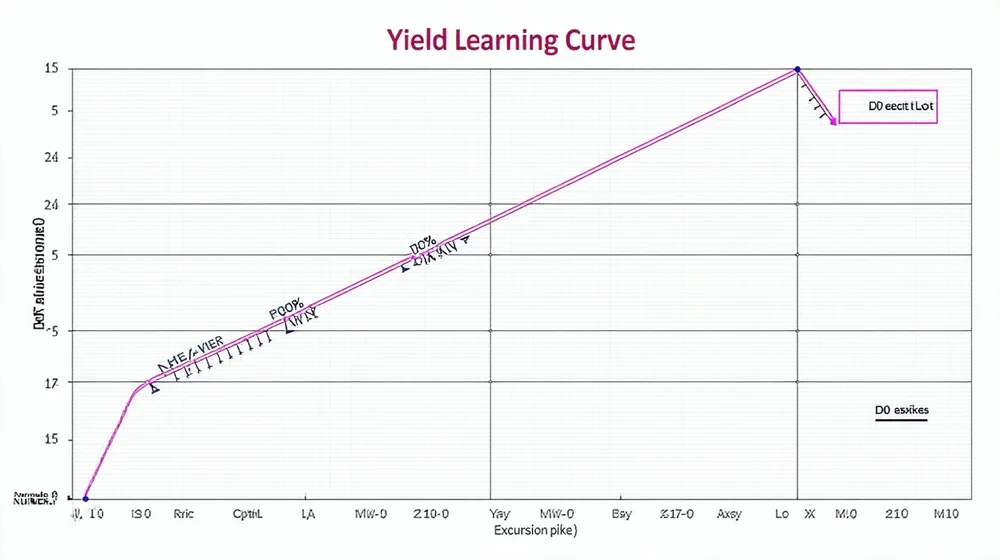
Yield Learning Curve Tracking
Tracks D0 defect density over lot sequence and time. Detects systematic excursions, quantifies yield impact, and flags when D0 deviates from the expected learning trajectory.
Pareto Excursion Analysis
Ranks yield loss contributors by equipment, process step, defect type, and layer of origin. Updated automatically as new inspection data arrives.
Kill Ratio Computation
Correlates in-line defect density (D0) against WAT probe yield to compute the kill ratio: what fraction of detected particles are actually killing devices. Updated per lot.
Commonality Analysis
Identifies shared attributes among yield-outlier lots: same chamber, same slot, same recipe version, same operator shift. Ranked list of candidate root causes.
See the Yield Intelligence Engine on your data.
Bring your KLARF files to a technical evaluation. We'll run a correlation pass on real lot data in 30 minutes.